
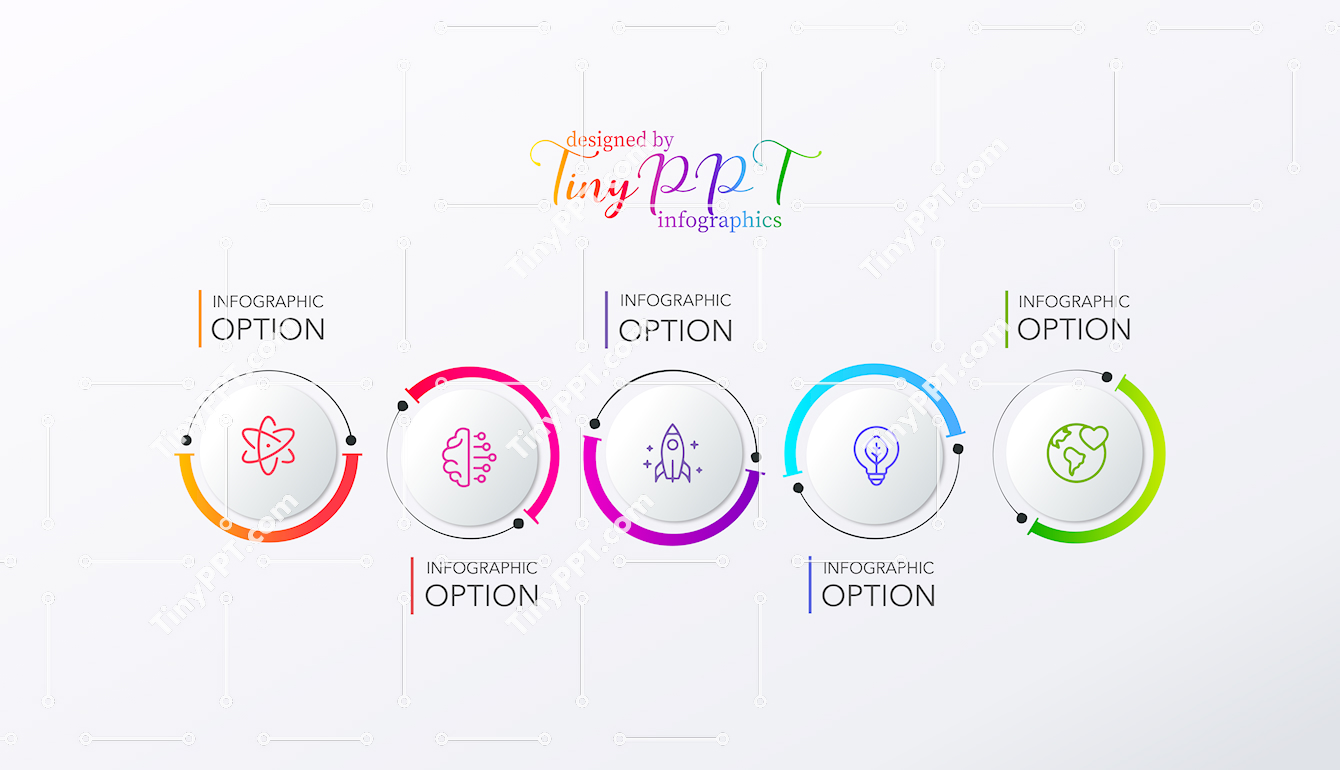
Show continuous improvement visually with this infographic PowerPoint designed in circular steps. Functioning as a process diagram, it communicates repetition, cycles, or feedback loops clearly. The PPT template fits business infographic contexts such as quality management or iterative planning. Its balanced layout supports data visualization and works equally well as an education infographic. Teachers can apply it as a teaching infographic to explain recurring concepts or systems thinking. Supplied as an Editable PowerPoint, the design allows easy customization for professional powerpoint decks. This infographic slide helps audiences grasp continuity and relationships at a glance.

-
File type PPTX
-
Published December 15, 2025
-
Views 10
-
Downloads 6
Free
|
Free
Support me on Buy Me a Coffee.
Share
Related Templates
-
Cycle Pencil Infographic PowerPoint  Tiny PPT
0
Tiny PPT
0
-
Creative Cycle Pencil PPT
Tiny PPT
0
-
Cycle Pencil Loop Diagram PPT
Tiny PPT
0
-
Circular Options Flow PPT Slide
Tiny PPT
0
-
Cycle Spiral Pencil Diagram PPT
Tiny PPT
0
-
Cycle Pencil Ring Infographic PPT
Tiny PPT
0
-
Cycle Crayon Ideas PowerPoint
Tiny PPT
0
-
Radial Pencil Cycle Diagram
Tiny PPT
0
Give Thanks!
Give thanks to @tinyppt for sharing this template, the easiest way, sharing on social network