
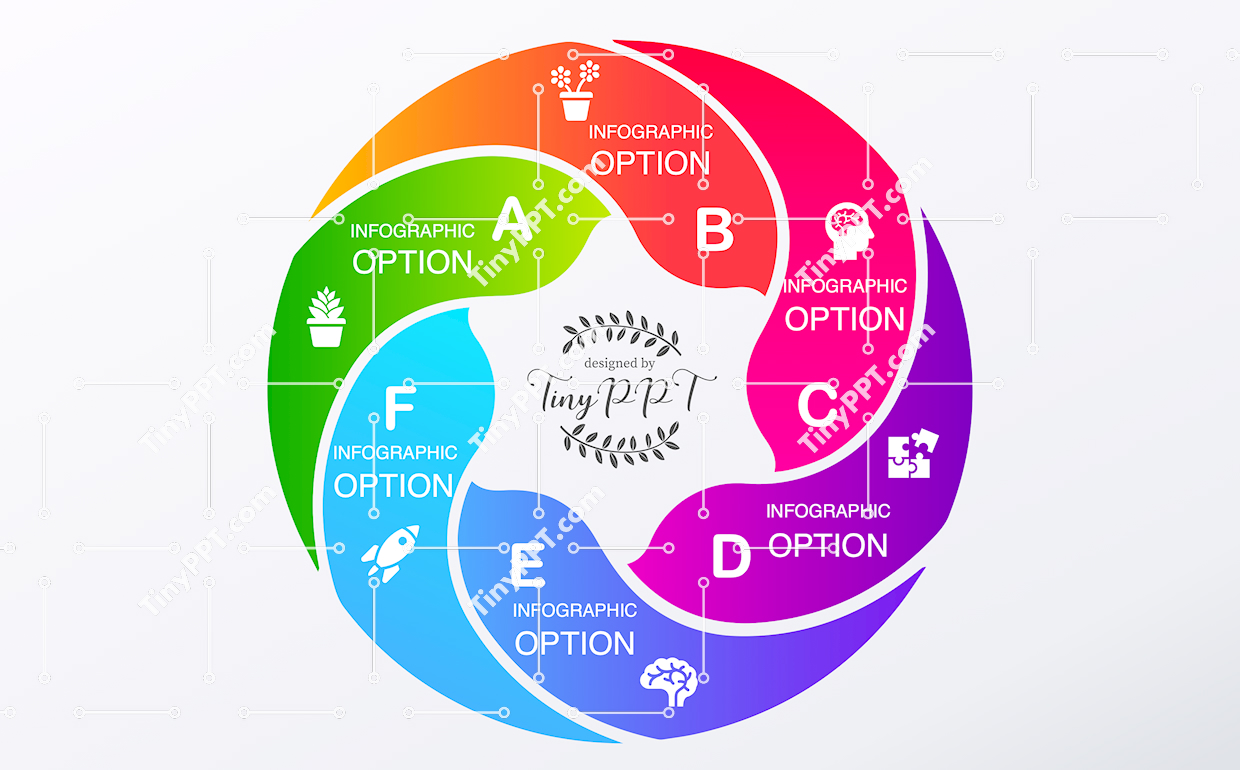
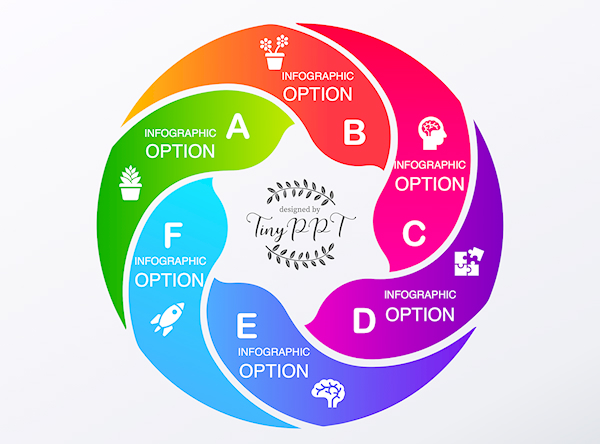
Demonstrates a continuous cycle concept through a smooth circular infographic ideal for recurring strategies or feedback systems. This infographic PowerPoint visually connects stages in a loop, helping users explain improvement models, learning cycles, or iterative business methods. The PPT template balances color-coded sections with icon support, enhancing data visualization for both classrooms and boardrooms. Designed as an Editable PowerPoint, it adapts easily for business infographic use, educational explanations, or teaching infographic scenarios. Trainers can map progress flows, while managers outline optimization cycles with clarity. The layout supports professional powerpoint standards and keeps attention focused on relationships between steps. Ideal for presentations that require logical continuity, this infographic slide helps audiences grasp repetition, refinement, and long-term planning effectively.

-
File type PPTX
-
Published December 15, 2025
-
Views 3
-
Downloads 0
Premium
|
$10.00 USD
Share
Related Templates
-
Circular Step Process Infographic Slide  Tiny PPT
0
Tiny PPT
0
-
Cycle Diagram PPT Slide
Tiny PPT
0
-
Cycle Diagram PowerPoint
Tiny PPT
0
-
Two Phase Cycle Infographic
Tiny PPT
0
-
Cycle Crayon Ideas PowerPoint
Tiny PPT
0
-
Four Stage Cycle Infographic PPT
Tiny PPT
0
-
Idea Cycle Infographic PPT Template
Tiny PPT
0
-
Cycle Process Rocket PPT
Tiny PPT
0
-
Creative Cycle Infographic PowerPoint
Tiny PPT
0
-
Cycle Pencil Arc Infographic PPT
Tiny PPT
0
-
Circular Segment Process Infographic PPT
Tiny PPT
0
-
Circular Steps PowerPoint Diagram
Tiny PPT
0
Give Thanks!
Give thanks to @tinyppt for sharing this template, the easiest way, sharing on social network