
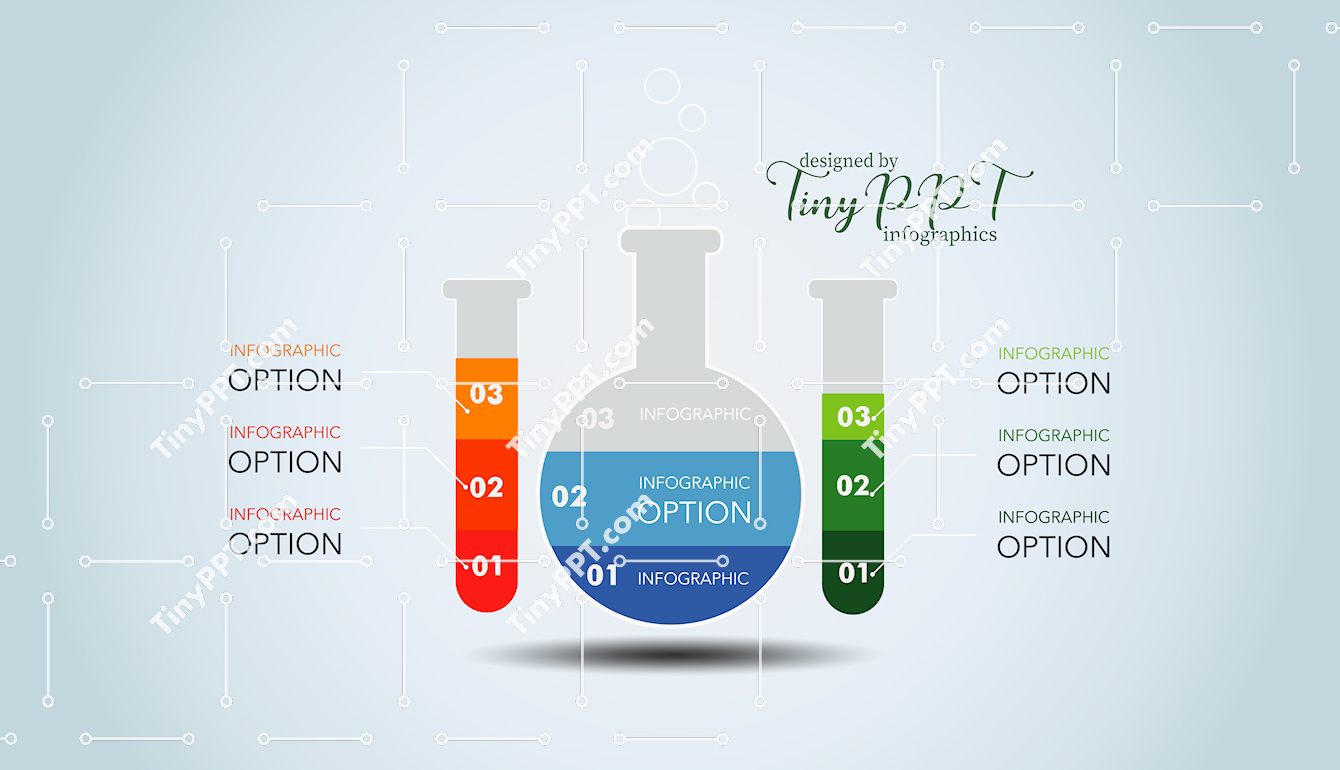
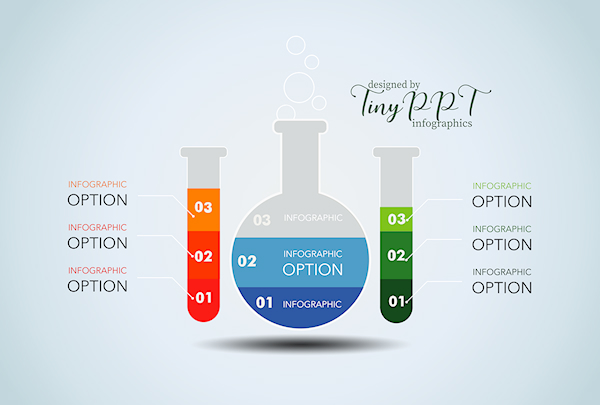
Explains steps or categories using laboratory glass visuals that suggest testing, analysis, or experimentation. This infographic PowerPoint fits business infographic reports, education infographic science lessons, and structured data visualization needs. Each container can represent stages, metrics, or variables, making it effective as a process diagram or teaching infographic. Trainers and educators benefit from its clear separation of information, while professionals can apply it to research, evaluation, or development presentations. Designed as an Editable PowerPoint, the PPT template supports easy text and color updates for professional PowerPoint decks. Use this infographic slide in classrooms, training sessions, or analytical business presentations.

-
File type PPTX
-
Published December 15, 2025
-
Views 3
-
Downloads 0
Premium
|
$10.00 USD
Share
Related Templates
-
Radial Process Infographic PowerPoint  Tiny PPT
0
Tiny PPT
0
-
Process Question Flow Infographic PPT
Tiny PPT
0
-
Creative Idea Funnel Infographic PPT
Tiny PPT
0
-
Process Growth Bar Diagram
Tiny PPT
0
-
Curved Timeline Infographic PPT
Tiny PPT
0
-
Symmetric Relationship Process PPT
Tiny PPT
0
-
Circular Process Diagram PPT
Tiny PPT
0
-
Horizontal Process Timeline Slide
Tiny PPT
0
-
Step Sequence Diagram PPT
Tiny PPT
0
-
Circular Hub Process Diagram
Tiny PPT
0
-
Hand Raise Options Infographic PPT
Tiny PPT
0
-
Diamond List Infographic PowerPoint
Tiny PPT
0
Give Thanks!
Give thanks to @tinyppt for sharing this template, the easiest way, sharing on social network