
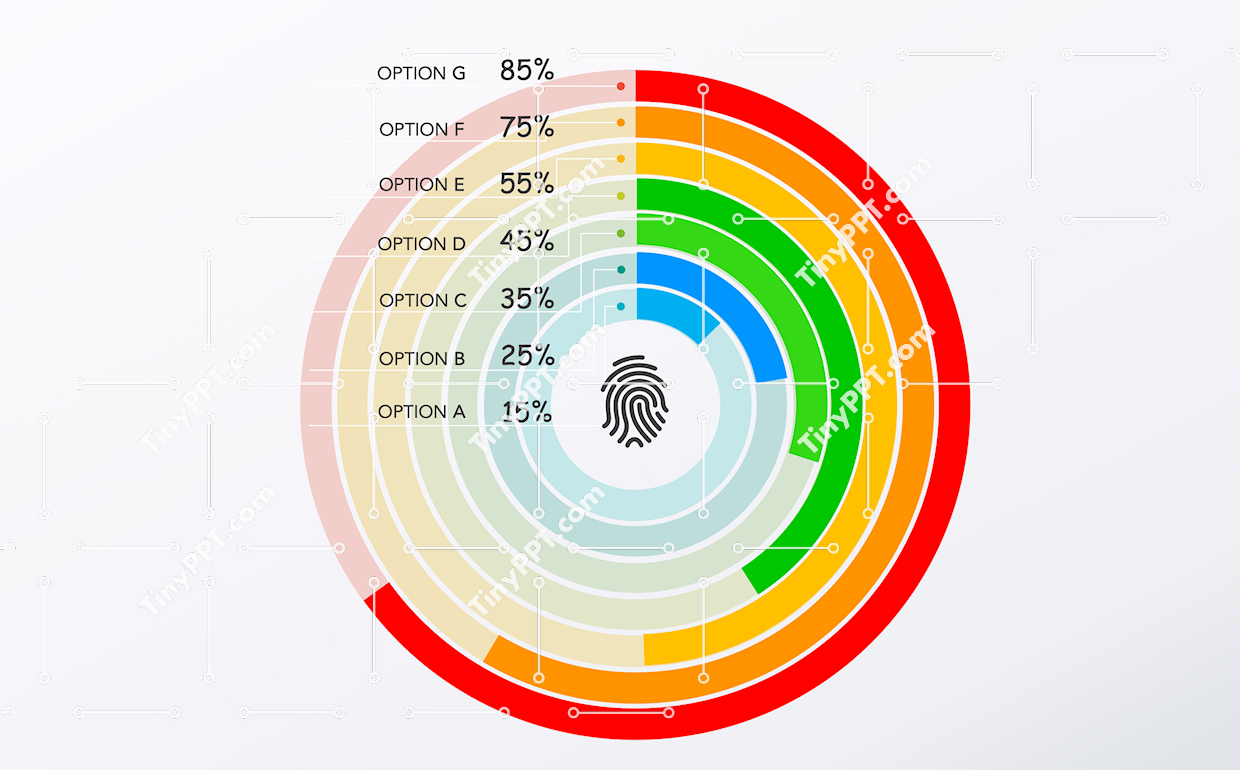
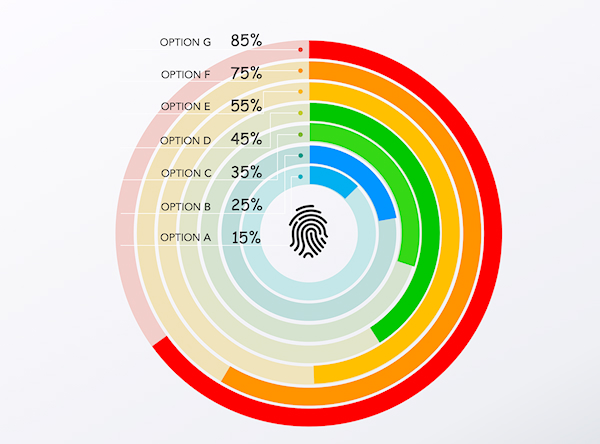
Visualizes layered progress using concentric rings that clearly display percentages and performance levels. This infographic PowerPoint design is effective for KPI reviews, assessments, and analytical business infographic reporting. Structured for data visualization, the slide highlights comparative values while maintaining a clean, professional look. Editable PowerPoint features allow analysts and educators to adjust scales, colors, and labels easily. In education infographic contexts, it supports lessons on measurement, evaluation, or statistics. As a teaching infographic, it helps learners interpret progress intuitively. Suitable for executive dashboards, classroom explanations, or marketing performance summaries, this PPT template enhances clarity and credibility. Its organized layout ensures audiences quickly understand trends and outcomes during presentations.

-
File type PPTX
-
Published December 15, 2025
-
Views 3
-
Downloads 0
Premium
|
$10.00 USD
Share
Related Templates
-
Education Flow Pencil Diagram  Tiny PPT
0
Tiny PPT
0
-
Layered Card Workflow Infographic PPT
Tiny PPT
0
-
Step Sequence Diagram PPT
Tiny PPT
0
-
Linked Process Bars PowerPoint Diagram
Tiny PPT
0
-
Arrow Flow Process PowerPoint
Tiny PPT
0
-
Strategy Roadmap Process PPT
Tiny PPT
0
-
Creative Idea Process Infographic
Tiny PPT
0
-
Six Step Process Diagram PPT
Tiny PPT
0
-
Radial Flow Diagram PPT
Tiny PPT
0
-
Mobile App Steps Process PPT
Tiny PPT
0
-
Horizontal Process Timeline Slide
Tiny PPT
0
-
Six Step Cycle Diagram PPT
Tiny PPT
0
Give Thanks!
Give thanks to @tinyppt for sharing this template, the easiest way, sharing on social network