
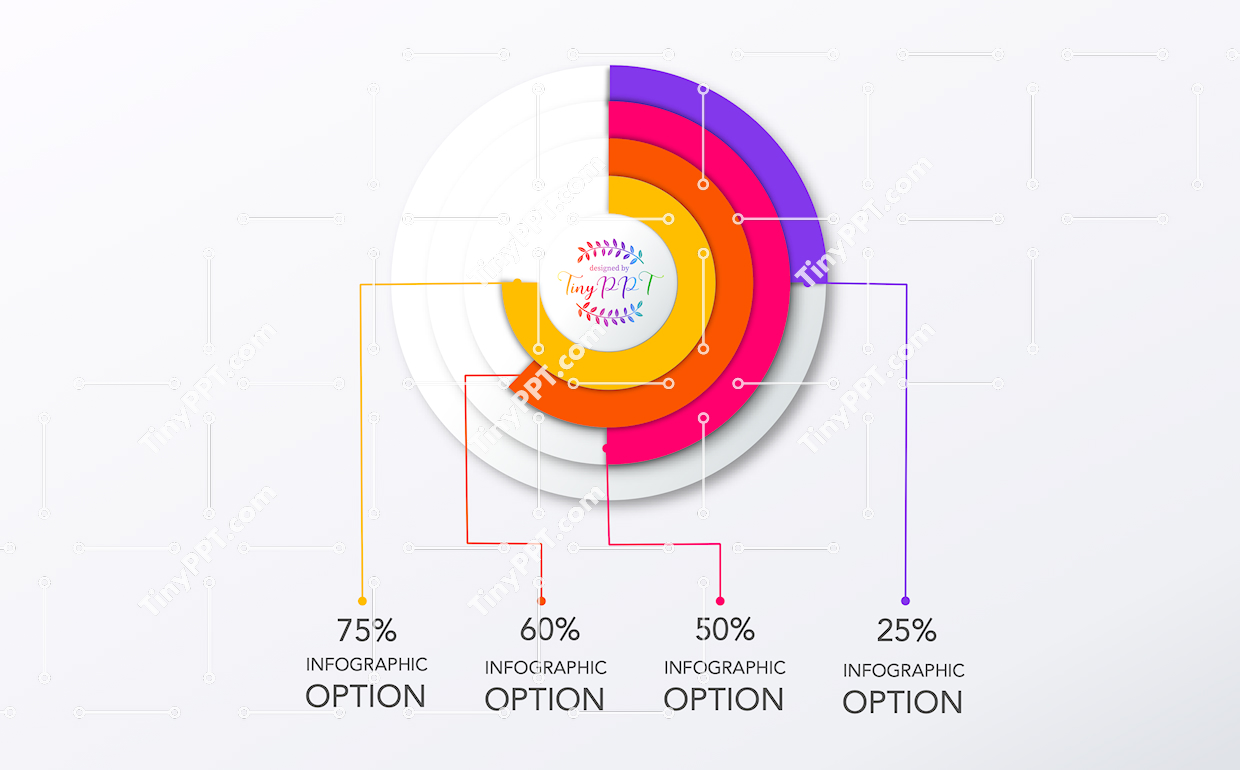
Highlights proportional data using concentric rings that compare values visually. This infographic PowerPoint is well suited for business infographic presentations focused on performance metrics, survey results, or financial breakdowns. The format strengthens data visualization by turning numbers into intuitive visuals. In education infographic settings, teachers can explain percentages, statistics, or comparisons with ease. Trainers may adapt it as a teaching infographic for analytical topics. Provided as an Editable PowerPoint, the PPT template supports professional PowerPoint usage across reports, lessons, and strategic reviews where infographic slides enhance comprehension.

-
File type PPTX
-
Published December 15, 2025
-
Views 3
-
Downloads 0
Premium
|
$10.00 USD
Share
Related Templates
-
Circular Hub Process Diagram  Tiny PPT
0
Tiny PPT
0
-
Numbered Circles Process PPT
Tiny PPT
0
-
Multi Step Cards Infographic Template
Tiny PPT
0
-
Vertical Sequence Loop Infographic PPT
Tiny PPT
0
-
Layered Circular Steps PPT
Tiny PPT
0
-
Workflow Steps Banner Infographic
Tiny PPT
0
-
Process Cycle Gift Diagram PPT
Tiny PPT
0
-
Four Stage Learning Diagram PPT
Tiny PPT
0
-
Diamond Process Flow PPT Template
Tiny PPT
0
-
Process Growth Arrows PPT Slide
Tiny PPT
0
-
Workflow Tree Infographic PowerPoint
Tiny PPT
0
-
Four Direction Process Diagram PPT
Tiny PPT
0
Give Thanks!
Give thanks to @tinyppt for sharing this template, the easiest way, sharing on social network