
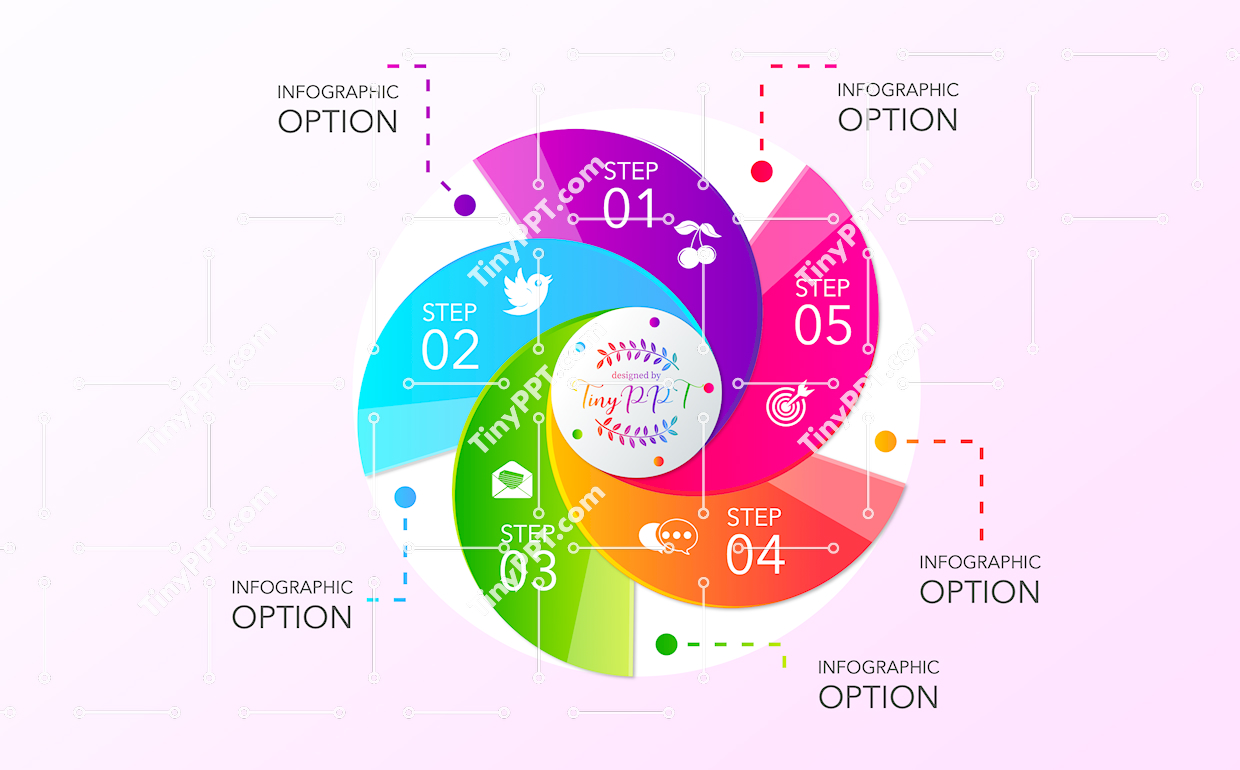
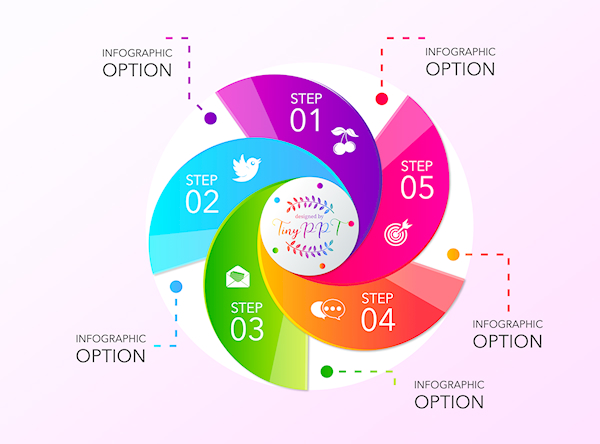
Illustrates a colorful circular flow designed to communicate sequential thinking in presentations. This infographic PowerPoint works well as a process diagram for explaining workflows, project phases, or recurring business operations. Each segment clearly supports step-by-step storytelling, making it ideal for a business infographic used in strategy reviews or operational meetings. The PPT template emphasizes clarity and balance, allowing data visualization elements such as icons, metrics, or short labels to stand out without clutter. With Editable PowerPoint formatting, teams can quickly adjust colors, icons, and text to align with brand guidelines. Educators can also adapt this slide as an education infographic to explain cycles, systems, or cause-and-effect relationships in classrooms. The layout supports teaching infographic needs by guiding learners visually through ordered steps. Designed for professional PowerPoint use, this infographic slide enhances business presentations, training materials, and instructional decks where structure and flow are essential.

-
File type PPTX
-
Published December 15, 2025
-
Views 3
-
Downloads 0
Premium
|
$10.00 USD
Share
Related Templates
-
Global Travel Routes Infographic PPT  Tiny PPT
0
Tiny PPT
0
-
Arrow Growth Infographic Template
Tiny PPT
0
-
Creative Process Infographic PPT
Tiny PPT
0
-
Five Step Process Diagram PPT
Tiny PPT
0
-
Four Steps Process Diagram PPT
Tiny PPT
0
-
Vertical Process Ribbon Infographic Slide
Tiny PPT
0
-
Process Flow PowerPoint Template
Tiny PPT
0
-
Six Step Process Diagram PPT
Tiny PPT
0
-
Four Step Cycle Infographic Template
Tiny PPT
0
-
Vertical Process List Infographic PPT
Tiny PPT
0
-
Horizontal Steps Infographic PPT Slide
Tiny PPT
0
-
Circular Puzzle Relationship Slide
Tiny PPT
0
Give Thanks!
Give thanks to @tinyppt for sharing this template, the easiest way, sharing on social network