
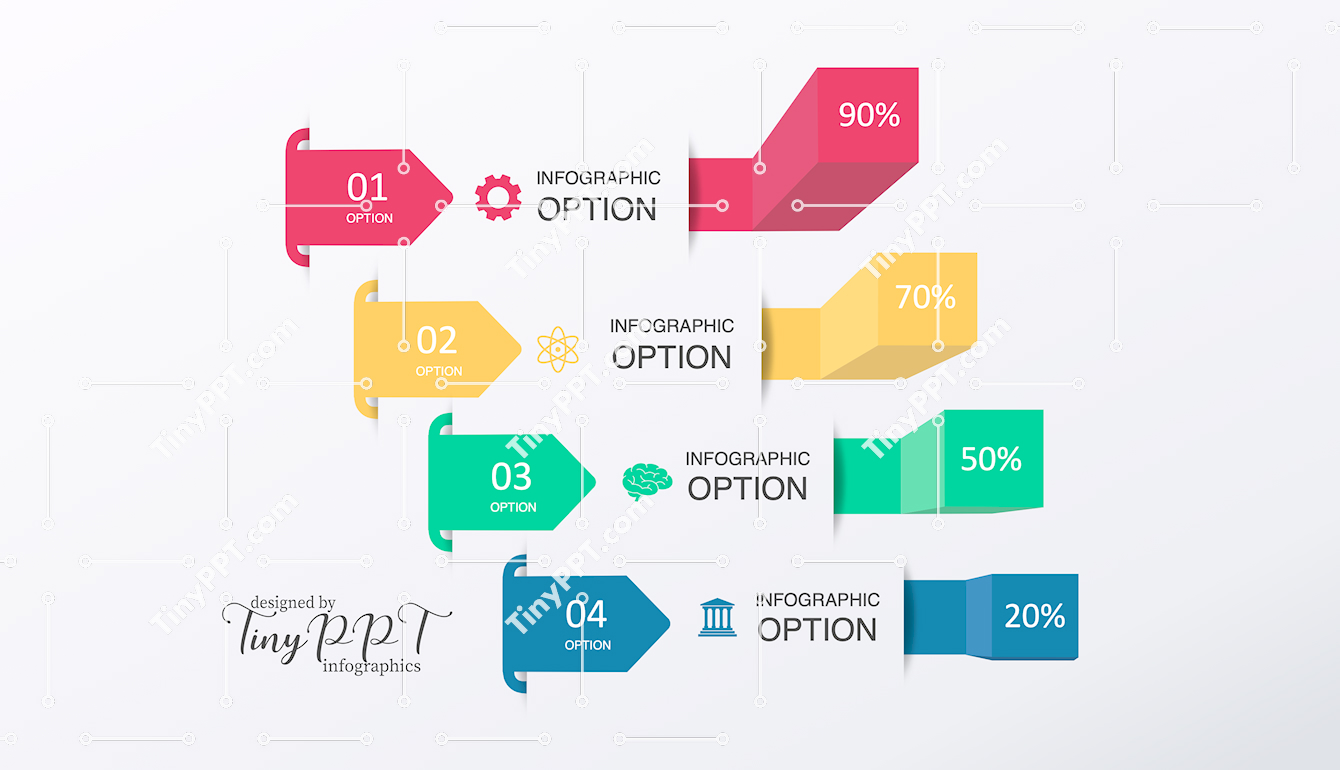
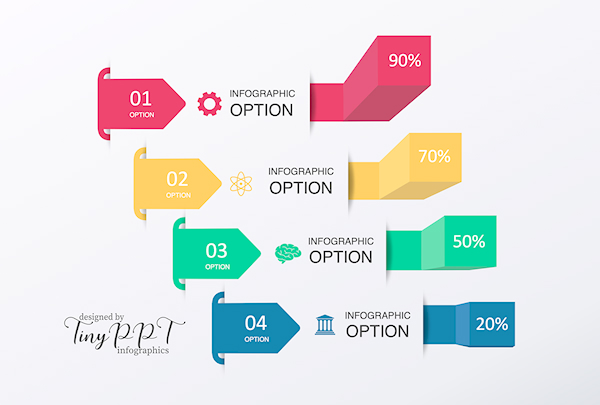
Displays progress values using directional bars and percentages for quick performance insights. This infographic PowerPoint is effective for reporting results, KPIs, or milestones. Organizations can rely on it as a business infographic to communicate achievements clearly. Educators may also adapt it as a teaching infographic for numerical comparisons. The structured layout strengthens data visualization without clutter. Created as an Editable PowerPoint, percentages and labels can be updated instantly. This PPT template fits business presentation reports and instructional slides. The infographic slide maintains a professional PowerPoint style focused on clarity and impact.

-
File type PPTX
-
Published December 15, 2025
-
Views 3
-
Downloads 0
Premium
|
$10.00 USD
Share
Related Templates
-
Vertical Step Process PPT Template  Tiny PPT
0
Tiny PPT
0
-
Seven Step Process Cycle PPT
Tiny PPT
0
-
Numbered Steps Infographic PPT
Tiny PPT
0
-
Clean Steps Process PPT
Tiny PPT
0
-
Directional Arrow Process PowerPoint
Tiny PPT
0
-
Vertical Steps Timeline PPT
Tiny PPT
0
-
Vertical Steps Pencil Infographic
Tiny PPT
0
-
Lightbulb Idea Infographic PPT
Tiny PPT
0
-
Strategy Roadmap Process PPT
Tiny PPT
0
-
Idea Stack Infographic PowerPoint
Tiny PPT
0
-
Process Flow PowerPoint Template
Tiny PPT
0
-
Process Steps Ribbon PPT
Tiny PPT
0
Give Thanks!
Give thanks to @tinyppt for sharing this template, the easiest way, sharing on social network