
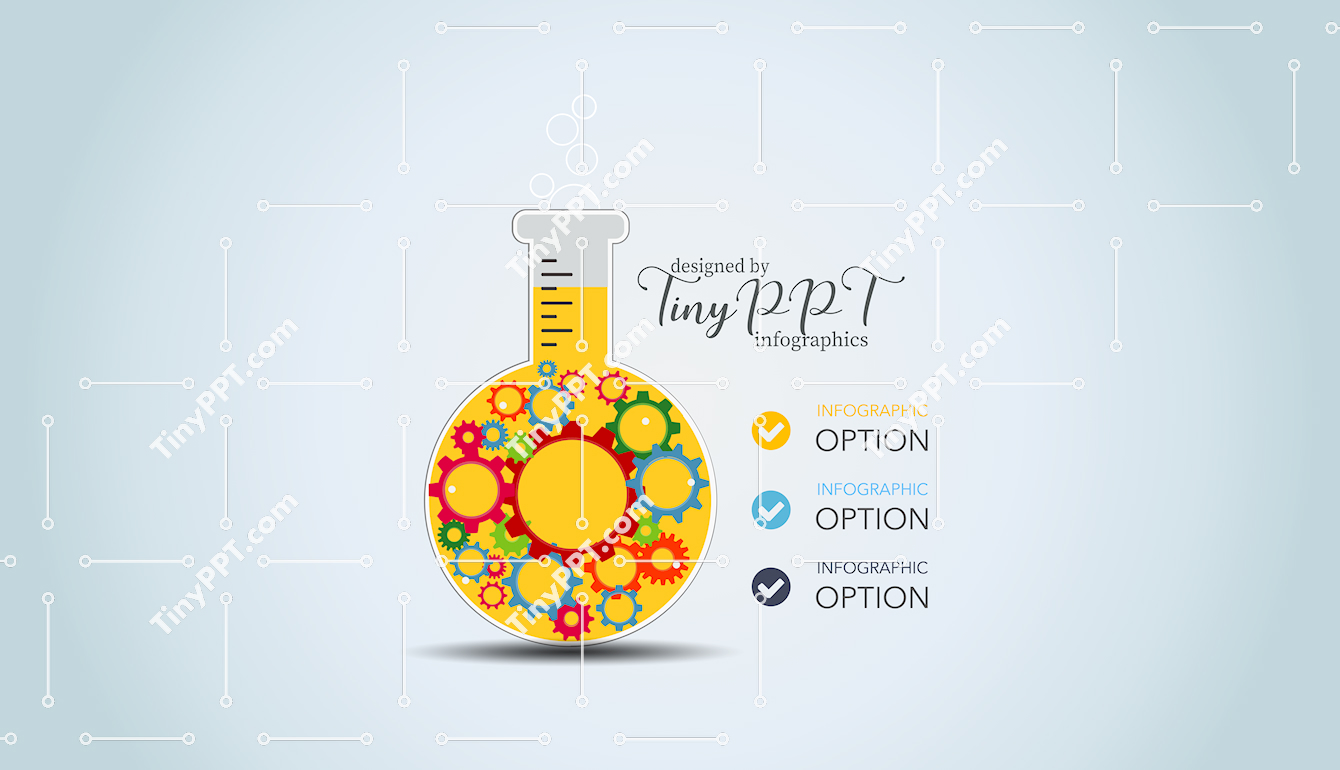
Explains continuous improvement through a circular laboratory-inspired infographic PowerPoint designed for cyclical concepts. This PPT template uses interconnected gear visuals inside a flask to represent iteration, innovation, or feedback loops. Businesses can employ this business infographic to communicate process optimization, R&D cycles, or operational improvement models. In classrooms, it works as a teaching infographic to illustrate cause-and-effect relationships or repeating learning stages. The design strengthens data visualization by emphasizing motion and connection rather than linear steps. As an Editable PowerPoint, all elements can be adjusted for branding, curriculum design, or workshop delivery. The slide blends education infographic clarity with professional PowerPoint aesthetics, making it effective for business, education, and teaching presentations that focus on ongoing cycles and systems thinking.

-
File type PPTX
-
Published December 15, 2025
-
Views 3
-
Downloads 0
Premium
|
$10.00 USD
Share
Related Templates
-
Workflow Bubble Cycle Infographic PPT  Tiny PPT
0
Tiny PPT
0
-
Pencil Cycle Infographic PowerPoint
Tiny PPT
0
-
Creative Cycle Infographic Slide
Tiny PPT
0
-
Cycle Diagram PPT Slide
Tiny PPT
0
-
Creative Cycle Pencil PPT
Tiny PPT
0
-
Four Step Cycle PowerPoint
Tiny PPT
0
-
Circular Step Process Infographic Slide
Tiny PPT
0
-
Four Stage Cycle Infographic PPT
Tiny PPT
0
-
Circular Steps Diagram Template
Tiny PPT
0
-
Puzzle Cycle Diagram PPT Template
Tiny PPT
0
-
Six Step Cycle Diagram PowerPoint
Tiny PPT
0
-
Cycle Infographic PowerPoint Star
Tiny PPT
0
Give Thanks!
Give thanks to @tinyppt for sharing this template, the easiest way, sharing on social network